The May, 2010, issue of the Communications of the ACM (CACM – the flagship magazine of the ACM) features a photograph of UMM CSci alum Tyler Hutchison presenting research work done with Andy Korth and Nic McPhee at MICS 2007. The article is “Student and Faculty Attitudes and Beliefs About Computer Science”. Andy and Tyler … Continue reading "I’m published in CACM! (But not in the way one might have thought)"]]>
Warning: Undefined array key "HTTP_REFERER" in /home/unhinder/www/www/Phi/wp-content/plugins/google-hilite.php on line 58

The May, 2010, issue of the Communications of the ACM (CACM – the flagship magazine of the ACM) features a photograph of UMM CSci alum Tyler Hutchison presenting research work done with Andy Korth and Nic McPhee at MICS 2007. The article is “Student and Faculty Attitudes and Beliefs About Computer Science”. Andy and Tyler won the best student paper award at that year’s MICS for their paper “On the impact of geography and local mating in evolutionary computation”. The photo (taken by me during Tyler and Andy’s joint MICS presentation) features some of Tyler’s artwork illustrating the material.
The graphics folks at CACM found my photo on Flickr, and contacted me via Flickr offering to pay me a small fee if I’d be willing to let them use it. I happily said "Yes", and the rest is history.
As well as being a cool computer-science-type, Tyler is also a cool comic-art-type, and did the nifty drawings for the cover of our book "A field guide to genetic programming".
Happy, happy, happy.
But I’m easily amused :-).
In fairness, this could well be the one and only time I ever get published in CACM. I’m not all that likely to submit an article to them (in part because I don’t tend to write things they might want), so this could easily be the pinnacle of my career in terms of the number of people in my field seeing my work.
Weird.
But cool.
]]>Just stumbled across Wordle, a neat tag cloud/text visualization tool, and am having way too much fun. Some of my most common Flickr tags (click on the cloud to see it bigger on Wordle’s site): The contents of the front page of my blog as of 3 July 2008: I like how the latter captures … Continue reading "Wordle makes tag clouds all pretty"]]>
Warning: Undefined array key "HTTP_REFERER" in /home/unhinder/www/www/Phi/wp-content/plugins/google-hilite.php on line 58
Some of my most common Flickr tags (click on the cloud to see it bigger on Wordle’s site):

The contents of the front page of my blog as of 3 July 2008:

I like how the latter captures our time in Spain quite nicely, and I really like how Wordle can intermingle the ascenders and descenders. Wordle can grind pretty hard on your CPU, but there are lots of neat options to play with and some very fun results to be had. w00t!
Thanks to banned photography inc for the tip.
]]>Sometimes you’re just minding your own business, trying to get a little science done, and a little art pops out at you all unexpected. What?!? You want to know where this comes from? All is revealed beneath the fold… The dotted line is, not surprisingly, the sine function plotted from about -10 to +15. The … Continue reading "Not quite a wave"]]>
Warning: Undefined array key "HTTP_REFERER" in /home/unhinder/www/www/Phi/wp-content/plugins/google-hilite.php on line 58

Sometimes you’re just minding your own business, trying to get a little science done, and a little art pops out at you all unexpected.
What?!? You want to know where this comes from? All is revealed beneath the fold…
The dotted line is, not surprisingly, the sine function plotted from about -10 to +15. The dashed line is a crazy rational function evolved using genetic programming. The bold line shows where the test data came from that was used to evaluate the quality of the evolved solutions, and it’s clear that in that range the evolved function matches very closely.
It’s also clear that outside of that range (which was never part of the evolutionary training), the evolved function rapidly wanders off into its own happy place (including a nifty discontinuity at around x=10). This is in fact to be expected. The GP system was only allowed to use +, *, -, and /, i.e., all it could construct were rational functions. There are no rational functions that match sine across its entire range, so this is really about as good as we could do given those tools. If we’d given the GP system a periodic function (like cosine) in its toolkit, then it could potentially evolve something that would match sine everywhere. With rational functions, though, it just ain’t gonna happen.
But this graph looks a lot cooler than it would if they matched everywhere :-).
Oh?
The function that it actually evolved?
You sure you want to see that?
Well, OK…
where
- a = 2.76609789995
- b = 10.240744822
- c = 3.9532436939
- d = 3.20011637632
- e = 12.6508398844
I never promised it would make a lot of sense, did I? Evolution often doesn’t produce pretty. So much for intelligent design…
]]>As mentioned before, I’ve been pretty insanely busy, trying to get four different co-authored research papers ready in time for the submission deadline next week for one of the major conferences in my field. Part of the reason I’m busy is that I procrastinate, but part of it is that I’m damnedly slow. And an … Continue reading "Rainbow curves (Lost imagery)"]]>
Warning: Undefined array key "HTTP_REFERER" in /home/unhinder/www/www/Phi/wp-content/plugins/google-hilite.php on line 58

As mentioned before, I’ve been pretty insanely busy, trying to get four different co-authored research papers ready in time for the submission deadline next week for one of the major conferences in my field. Part of the reason I’m busy is that I procrastinate, but part of it is that I’m damnedly slow. And an important part of that is that I spend roughly forever making and fiddling with graphs.
See, I just love a good graph. One of my great goals in life is to give a standard length (20-30 minute) conference talk where my entire collection of slides is just one gorgeous, illuminating, data rich graph. The graph would need to have all the information I want to convey and enough to support 20 minutes of me talking about it. So far I’ve not come anywhere close. I’ve occasionally had single graphs that could support more than five minutes of presentation, but I’m not sure I’ve ever hit 10. But I’m working on it.
In the meantime, I tend to collect vast whale bellies full of data (my research generates data with wild abandon), and then make plot after plot after plot, trying to figure out both what the data says, and how I can best share that with my potential audience. Hours and hours constructing different views on the mystery. And, of course, I don’t then leave them alone. No, I fiddle and twist, spindle and mutilate, trying to get it “right”.
Technical papers come with page limits, however, so many of these graphs wander around for a while through the land of drafts, only to have their ultimate fate be the rubbish bin of ruthless editing. Some I really like, but they lose out to the necessities of the day. Others were probably never destined for greatness, but served some purpose, like an intellectual scaffolding that helped me build my understanding and argument, but was always going to come down when the construction was finished.
This image combines three of those pieces of scaffolding, freed of their labels and tickmarks, but together as team. I knew all along that these weren’t gonna make the big time, but I needed to plot them to make sure that my intuition about them was (mostly) correct. It was, they served their purpose, and now they’re off to oblivion. Except that I just liked the way these looked, so I joined them all up like little Legos to preserve here on Flickr.
You can think of it as a curvy Mondrian, without being nearly as good :-).
]]>I just discovered The Gapminder, a very cool visualization tool created by Hans Rosling and others. It gives you the ability to visualize changes in a variety of socio-economic indicators across both space and time, with particularly effective use of simple animations across the time dimension. It’s really cool to play with, and there are … Continue reading "The power of good visualization"]]>
Warning: Undefined array key "HTTP_REFERER" in /home/unhinder/www/www/Phi/wp-content/plugins/google-hilite.php on line 58
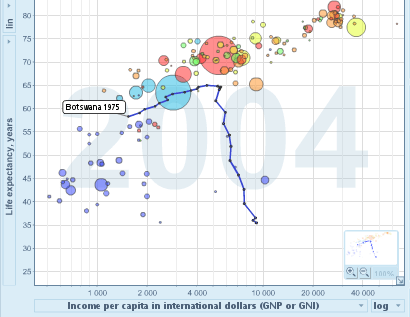
I just discovered The Gapminder, a very cool visualization tool created by Hans Rosling and others. It gives you the ability to visualize changes in a variety of socio-economic indicators across both space and time, with particularly effective use of simple animations across the time dimension.
It’s really cool to play with, and there are a lot of things you can change that aren’t immediately obvious (I found the short demo in the on-line help quite helpful). You can certainly learn a lot by goofing around with it (as well as generate a lot of meaningless visual noise). The screenshot above is from a plot of life expectancy vs. per capita income over time (the default plot you get when you start it up). I had to watch it a few times to sift out some trends, but after getting past the obvious “generally, more money means longer life” I realized that lots of blue bubbles (i.e., African countries) were “falling” out of the cloud at the end like particulates settling out of a liquid. This indicates that their life expectancy has plummeted in the last few years, which is obviously not the right direction. Why? Almost certainly the continuing AIDS crisis in large parts of Africa, and visualizations like this make it painfully (literally) obvious that this must be cause for serious concern.
In the graph above, I’ve highlighted Botswana,which shows a particularly depressing case. Both their life expectancy and per capita incomes were moving in a happy direction until the early 90’s when, despite continued gains in per capita income (which I’d like to know more about), their life expectancy flew the wrong direction.
Take a second to think about the enormous human suffering a change like that implies.
Thanks to John Hawks for the pointer. Hawks points out that the use of circles of different areas probably isn’t a great way to visualize quantitative differences (a general point Tufte raised years ago), but Rosling’s going for quick impact rather than quantitative precision:
So far, we have had a major hit with two target groups: children under 12 and heads of state. What they have in common is that you have only 5 to 10 seconds to impress them.
(You just have to love the reality that you need the same tools to communicate with little kids and world leaders. Maybe we should just put the little kids in charge? They might have more empathy.)
One thing that really annoyed me when I wrote this post was the fact that you can’t easily embed these graphs in a web page. I don’t think I’d really appreciated how used I’d grown to being able to embed images, video, maps, slideshows, and the like in blog posts. I think embedding has become absolutely key to the success and mass propagation on the web, and people designing new tools (or updating existing ones) better keep that in mind.
]]>